Analyse
Reports
Trends, funnels, cost and latency.
What Reports is for
Conversations answers questions about one call. Reports answers questions about all of them: whether volume is climbing, which agent converts, why calls end early, and where your spend goes. It is the same data, aggregated.
Reports has a filter bar across the top and four tabs beneath it. The tab you are on is kept in the URL, so a report you have filtered and tabbed to is a link you can send to a colleague.
The filter bar
The filter bar is the same filter system Conversations uses, with the same three groups of dimensions: Essential (Direction, Call Status, Conversation Goal Status, Agent with per-version selection, Date Range, Sentiment), Quality (Disconnection Reason, Human Transfer, Call Abandoned, Quality Flag) and Other (Call Type, Duration). Everything on every tab respects it.
Two habits make the numbers trustworthy. Set the Date Range deliberately rather than reading the default window, and use Call Type, which separates Live from Test, when you want production traffic only.
Overview
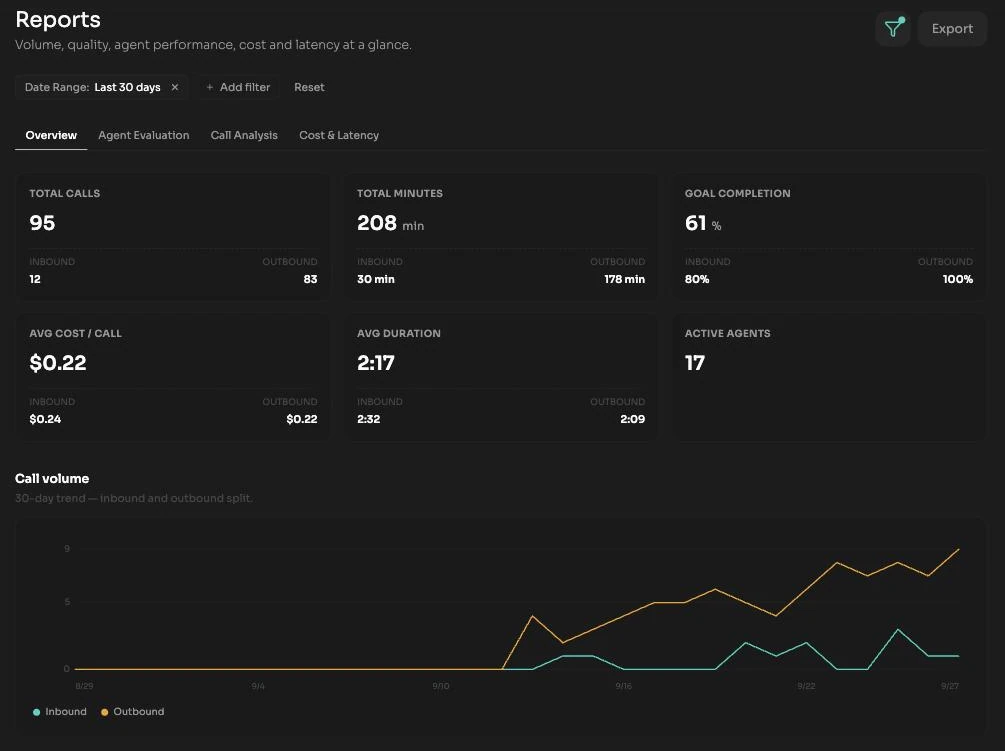
Overview is the health check. Its KPI tiles are Total Calls, Total Minutes, Goal Completion, Avg Cost / Call, Avg Duration and Active Agents.
Below the tiles:
- A Call Volume trend chart, split into inbound and outbound so a change in one does not hide a change in the other.
- A Sentiment breakdown across Positive, Neutral and Negative.
- A Goal Completion trend of Success against Failed over time.
Agent Evaluation
Agent Evaluation is per-agent quality analysis: how well each agent followed its instructions and held up across its conversations, aggregated over the filtered window rather than judged one call at a time. Filter to a single agent and a single version to see whether a change you published moved quality in the direction you intended.
Call Analysis
Call Analysis is where calls that did not go well get explained. It treats inbound and outbound traffic separately, because they fail in different ways.
Inbound funnel
For incoming calls the breakdown is a funnel: Completed, Abandoned, Not Answered and Transfer. Abandoned calls are the ones to watch, since they usually point at the opening of the conversation rather than anything the agent said later.
Outbound reachability and outcomes
For outgoing calls the equivalent breakdown is reachability: Goal Achieved, Machine Detected, No Answer and Busy-Failed. This separates an agent problem from a list problem. A campaign that is mostly Machine Detected and No Answer is not being let down by the prompt.
Volume and disconnection reasons
The tab also charts inbound against outbound volume, and breaks down why calls ended:
| Disconnection reason | What it tells you |
|---|---|
| User hangup | The person on the other end ended the call. |
| Agent ended | The agent closed the call, normally because its end call instructions were satisfied. |
| Human transfer | The call was handed to a person. |
| Timeout | The call ran into a configured limit rather than reaching a natural end. |
| Network error | The call dropped for technical reasons. |
The same values exist as a filter, so you can go from a spike in one reason straight to the calls behind it by applying Disconnection Reason in Conversations.
Cost & Latency
Cost & Latency answers two questions at once: what your calls cost, and how quickly the agent responds.
- A per-agent cost table, so you can see which agent is carrying your spend rather than only the workspace total.
- A cost breakdown across STT (speech to text), LLM (the model doing the thinking), TTS (text to speech) and Tool calling.
- Latency metrics for the same filtered window.
The breakdown is the useful part when a number surprises you. Cost dominated by tool calling points at an integration being invoked more than you expected; cost dominated by TTS usually points at call length.
Email this report
Email this report generates a PDF of the report as currently filtered and emails it out.
- Set the filters and open the tab you want captured.
- Click Email this report. You will see We'll generate a PDF and email it to everyone below.
- Your own email address is filled in by default. Edit it or add more, up to ten recipients in total. Each one is validated as a real email address.
- Send. The PDF is generated and delivered to the list.
Reports and the Home overview
The Overview section on Home is drawn from exactly the same data as Reports, just windowed differently and shown with a smaller set of tiles. Its General, Agent Evaluation and Performance tabs each carry a View full report link that lands you on the matching Reports tab. So if a Home tile and a Reports tile disagree, the cause is the date range, not two different sources of truth.